| About the Doctor |
| Conditions Treated |
| Neuropsychological Assessment |
| Neuroimaging |
| Treatment Services |
| Office Location |
| Links |
|
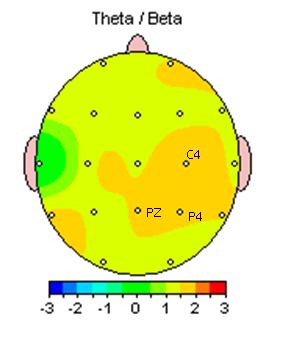
Quantitative EEG Analysis and Interpretation Brain electrical activity is digitally recorded on the Deymed TruScan 32 qEEG system from nineteen (at most thrity-two) scalp electrodes, with continuous on-line impedance monitoring, and in accordance with the International 10-20 System of Electrode Placement. Recordings are digitized and then edited to remove artifact (body movement, eye motion, or EMG contamination) prior to data analysis. Using Neuroguide software, age-related comparisons are made drawing from a large normative database extending from young children to adults. EEG is sampled in the awake state with ``eyes closed" and ``eyes open" positions. Results of spectral analysis from 1-30 Hz are displayed both numerically and as computed color-graduated topographic maps (brain maps) and compared to the standard EEG recording. The neurometric reference database contains several quantitative EEG measures, including absolute power, relative power, coherence, symmetry, phase, and mean frequency of the delta, theta, alpha, and beta frequency bands of the EEG at every electrode position of the International 10-20 System. How the Quantitative EEG is Used to Provide Specific Information about Each Child Using Neuroguide software designed by Robert Thatcher, a report is generated from the edited raw data for each file recorded. Data for individual frequencies from 1-30 Hz is examined, from which standard scores, known as Z scores, are calculated. The Z score is simply the number of standard deviations by which the observed data differs from the mean. In this way, your child's data is compared to those of other children of the same age who are part of the normative database. Amplitude (measured as power=μV2/Hz, where μV=microvolt) indicates the size of the brain wave signal with reference to the normative database. Z scores are used for each frequency between 1 and 30 Hz, and tell where within the normative distribution your child's QEEG falls compared to others of the same age. qEEG profiles may vary for any given diagnosis, and this is especially true for ADHD as those attentional factors which contribute to the diagnosis vary from one individual to the next. For example, in some cases there is excessive slow wave, or theta activity (4-7Hz) compared to the amount of beta activity (15-18 Hz) in the central area around Cz or Pz. In Fig. 1, the brain map illustrates a heightened theta/beta ratio 2 to 3 standard deviations above the mean for age at locations C4, Pz, and P4.
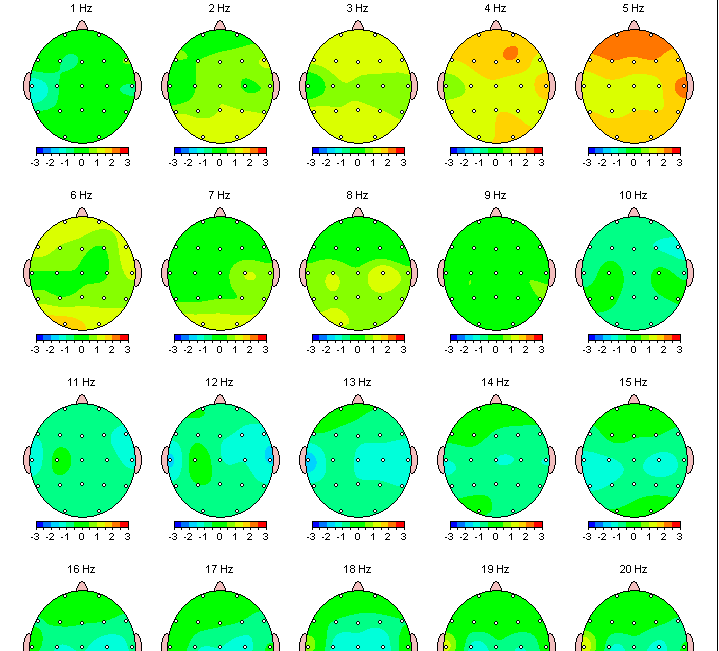
Sometimes, the attention deficit is due to excessive slow wave activity in a specific area of the brain. Fig. 2 depicts an ADD subject with excessively high amplitude frontal lobe activity at 4-5 Hz.
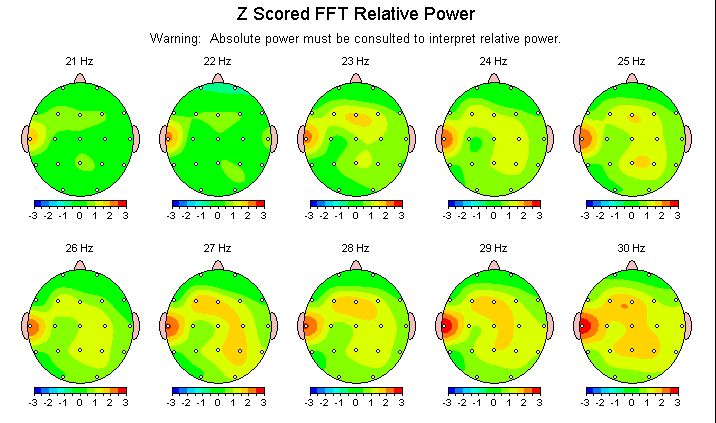
These patterns are correlated with general inattentiveness and poor capacity for sustained attention in certain activities, like staying on task at school or completing homework assignments after school. Attentiveness in self-directed activities, like playing video games or performing other tasks of high interest to the child, may not be affected. Other children have a normal amount of low frequency activity, but suffer from hyper-arousal caused by too much higher frequency (25-30 Hz) activity, as shown in Fig. 3, leading to hyperactivity and distractibility.
|
Home | Contact