| About the Doctor |
| Conditions Treated |
| Neuropsychological Assessment |
| Neuroimaging |
| Treatment Services |
| Office Location |
| Links |
|
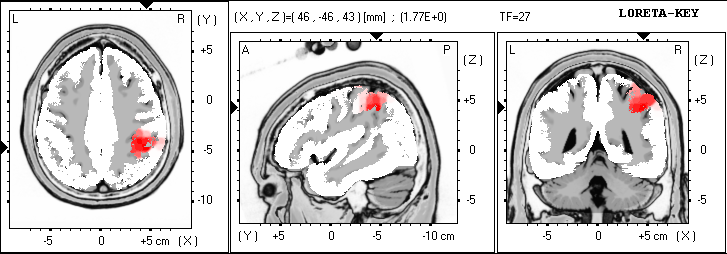
What Treatment Strategies are Available? Traditional therapies to address attention usually include a multi-modal approach involving counseling in the form of cognitive-behavioral therapy, medication management, and development of a 504 plan through a special committee at your child's school. Some children also require tutoring in specific subjects outside of school and an organizational program such as MAPS at school to assist the child with organizing daily assignments and long-term projects. A type of biofeedback which uses the brainwave EEG signals to provide auditory and visual cues back to the child during training is called neurofeedback. The child sits in front of a specially designed game computer screen that is connected to a separate computer or software instrument which simultaneously records the child's filtered EEG activity as the game progresses. Based upon the blueprint provided by the child's qEEG, thresholds are set so as to either decrease or increase the amplitude of the signal within the frequency range determined and at the particular brain site indicated. So, for example, as in the case of the child indicated in Fig. 2 where there is too much slow wave activity in the frontal area, especially to the right around the area F4, an electrode would be placed at this site and an attempt would be made to reduce the amplitude of activity in this area into the normal range. On the game computer, what the child sees is an image of something contingent upon what you are attempting to change. This might be, for example, a dot which increases in size as the slow wave activity gets larger and then decreases again as the amplitude decreases and the child becomes more focused. It is important that the task itself not be too engaging for the child, as the purpose is not to entertain but to motivate the child to want to control the EEG signal by decreasing the size of the object seen. Beeps or some other sound reward are also included, and a bar graph at the end of each trial is used to gain points towards a reward at the end of the session. Neurofeedback treatment in my office usually progresses at the rate of two 45 minute sessions per week up to the first twenty sessions, followed by some re-testing and parent consultation to determine the next step in treatment. The neurofeedback is offered as part of a full treatment regimen which includes parent feedback and counseling, consultation with teachers, school psychologists or school social workers. In this way, generalization of what is learned by the child in the office setting becomes applicable to both home and school. Coherence Training Coherence is a measure of the connectivity between any two brain sites. More specifically, it has to do with the shape of the wave forms in question rather than the amplitude of the signals, and measures the amount of phase stability or phase jitter between the signals over time. When the wave forms, thus compared, are determined to be either too similar or too different, a break down in communication occurs affecting whatever functions are characteristic of the sites affected. A recent study of Autism by Coben and Myers (Connectivity Theory of Autism: Use of Connectivity Measures in Assessing and Treating Autistic Disorders, J. Neurotherapy, V. 12, no. 2-3 (2008), pp 161-179) indicated patterns of hyperconnectivity in fronto-temporal and left hemispheric regions, whereas patterns of hypoconncectivity were seen in orbitofrontal, right posterior, frontal-posterior, and left hemispheric regions. Also, EEG oscillations in the μ frequency (8-13 Hz) over the sensorimotor cortex were associated with deficient mirror neuron activity, likely the result of a deficiency in coherence between central and frontal areas. Coherence training between occipital-temporal and medial temporal areas on the right side increased coherence between these areas. Frequent improvement in social pragmatics, interaction skills, and visual-perceptual, facial, prosodic processing skills were noted. Coherence training is connectivity training and requires specially designed software, different from that used in neurofeedback for amplitude training previously described. In coherence training, two or more channels may be used, with an electrode placed on each of the sites to be trained, and then linked to both ears as reference. In one design, the person being trained sits before a computer screen and attempts to reduce the length of a colored bar representing a specific frequency range while a tone is heard which increases in pitch as the bar is shortened to reduce the amount of hypercoherence between the sites identified. In the case of hypocoherence, the attempt is made to increase the length of the bar with a similar increase in pitch as the goal is reached. Results can be easily checked against the original qEEG as progress is made. Coherence training has applications for a wide variety of different issues, dependent upon the functions of specific sites affected. A qEEG and full evaluation are required prior to treatment. Varied diagnostic issues which may be appropriate for this type of treatment include auditory processing and specific learning disabilities, issues related to deficits in working memory, mood enhancement and social/emotional self-regulation. The procedure itself is often found to be quite relaxing. LORETA Analysis LORETA (low resolution brain electromagnetic tomography) is an imaging technique pioneered by R.D. Pascual-Marqui of the Brain Mapping Laboratory of the University Hospital Zurich (Switzerland), which enables one to partially reconstruct the three dimensional neurological electromagnetic field from the surface data of scalp EEG measurements. The results were first published in the International Journal of Psychophysiology 18 (1994), pp. 49-65. Refinements of the original LORETA technique have since emerged, sLORETA (standardized LORETA) and eLoreta (exact LORETA), both of which attempt to minimize localization bias arising from the measurement apparatus or biological noise. As part of qEEG interpretation using a normative database, LORETA analysis is useful in helping to determinine functional deficits since it pinpoints specific areas of the brain showing greatest underactivity or overactivity relative to age-matched controls. The findings are then correlated with existing clinical information and neuropsychological test results, adding a physiological dimension to the patterns of information thus identified. The following illustrates the use of z-scored LORETA analysis as an aid to diagnostic evaluation and treatment planning. The first example (Fig. 4) depicts an individual with a chronic tic disorder. Increased activity in the parietal area, especially on the right, is a commonly observed feature and is often associated with compulsive behavior.
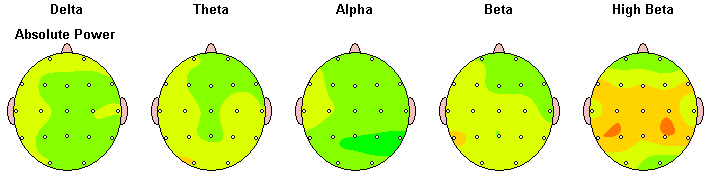
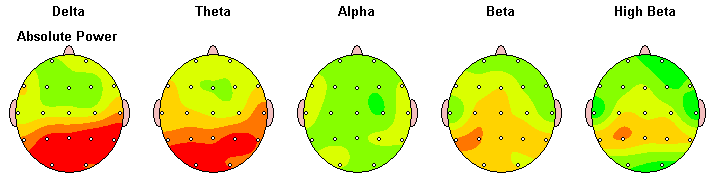
The z-scored absolute amplitude data (Fig. 5) on this same individual also shows increased amplitude, especially in the parietal area in the high beta range (25-30 Hz).
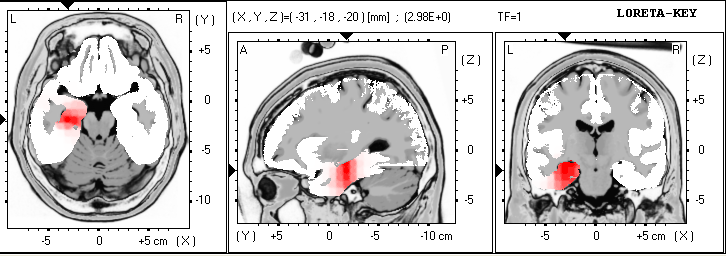
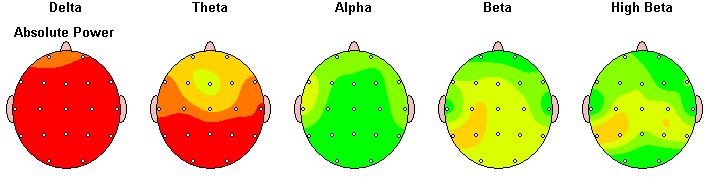
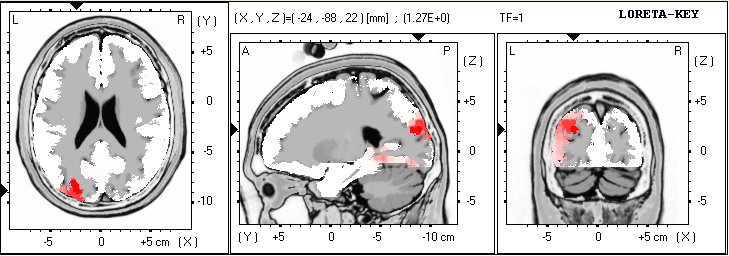
As part of treatment planning, decreasing amplitude in the desired frequency range, especially around P4, may be helpful in minimizing the symptoms presented. The second example is an individual suffering from exposure to lead poisoning. Overactivity in the left parahippocampal gyrus is noted and is associated with poor memory retrieval, especially visually encoded memory. Difficulty learning how to read and difficulty memorizing math facts were demonstrated. Training consisted of reducing both frontal and posterior slowing, especially on the left, and improving connectivity between the right and left hemishpheres. Fig. 6 and 7 show the pre-training brain maps and LORETA images while Fig. 8 and 9 show the corresponding post-training images after six months of training.
Fig. 8 presents the newer LORETA images for the same frequency as previously shown. The standard z-score shown is below the level of significance, indicating functioning within the normal range.
Fig. 9 shows considerably less slowing than in Fig. 7, but is still aberrant compared to the population of same age peers. School reports reveal significantly improved oral reading, reading interest and comprehension, and math skills at grade level.
Continued training is recommended for further improvements over time.
|
Home | Contact